Shopify Conversion Rate Statistics
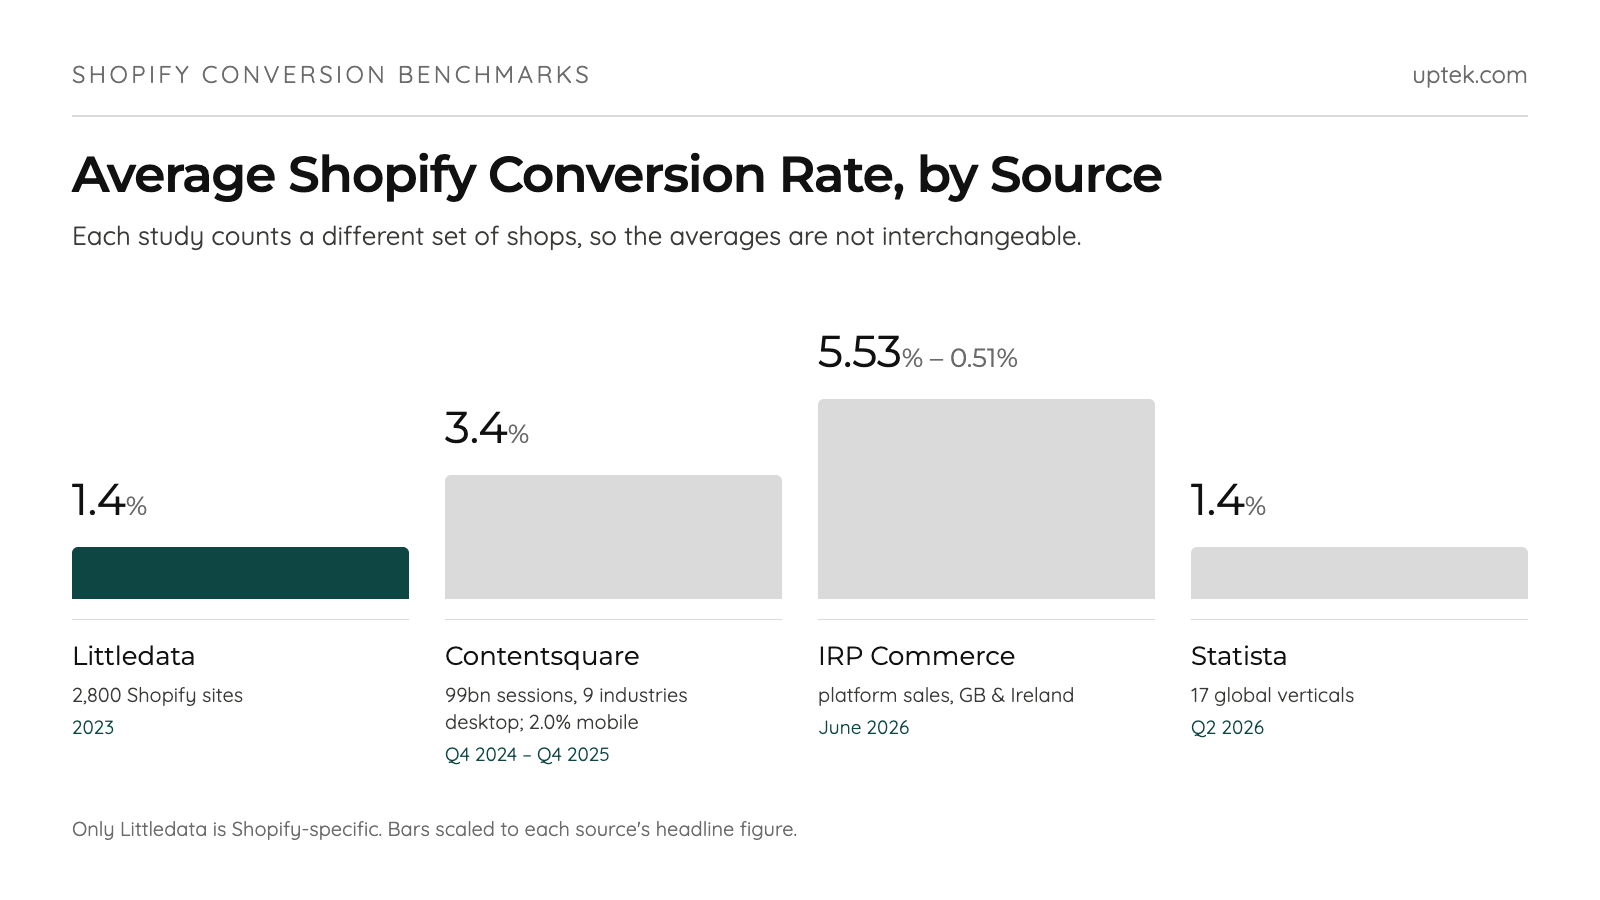
The average Shopify store converts at 1.4%, and nearly every page quoting that omits that the figure is from a 2023 data period. Every number below carries its source and period. Where sources disagree, you get both. These are the benchmarks we measure client stores against as a Shopify development company.
Conversion is one metric set of eleven tracked here, and the rest sit in our Shopify statistics report.
Key Findings
- 1.4% average Shopify conversion rate (Littledata, 2,800 Shopify sites, 2023).
- 3.2% is the top-20% threshold in that benchmark, 4.7% the top-10%.
- 5.53% to 0.51%: the June 2026 conversion spread across ten IRP Commerce verticals.
- Conversion fell 5.1% while order values rose 6% year over year (Contentsquare, 99bn sessions, to Q4 2025).
- 3.5% of conversion is lost per 100 milliseconds of load time on Shopify (Shopify, 27 April 2026).
- 70.22% average cart abandonment across 50 studies (Baymard), though 42% of US shoppers abandon because they’re browsing.
- 35.26% uplift is available from checkout design alone (Baymard), worth $260 billion in the US and EU.
- 54% better: AI traffic outconverted non-AI traffic on US retail in May 2026 (Adobe), after converting 43% worse in July 2024.
Which Benchmark Should You Use?
The benchmark you should use depends on what your store looks like, and these four disagree by a factor of four.
| Source | Headline figure | Basis | Period |
|---|---|---|---|
| Littledata | 1.4% avg, 4.7% top 10% | 2,800 Shopify sites | 2023 |
| Contentsquare | 3.4% desktop, 2.0% mobile | 99bn sessions, 9 industries | Q4 2024 to Q4 2025 |
| IRP Commerce | 5.53% to 0.51% by vertical | platform sales, GB and Ireland | June 2026 |
| Statista | 1.4% avg, 2.4% top vertical | 17 global verticals | Q2 2026 |
The gap is a denominator problem, not a data-quality problem.
Littledata counts Shopify sessions. Contentsquare counts tagged sessions across nine industries including travel, and IRP counts transactions on its own platform in two countries.
Only Littledata is Shopify-specific, and its data is three years old. If you’re comparing yourself to Contentsquare’s 3.4%, you’re comparing yourself to travel sites.
What Is a Good Conversion Rate on Shopify?
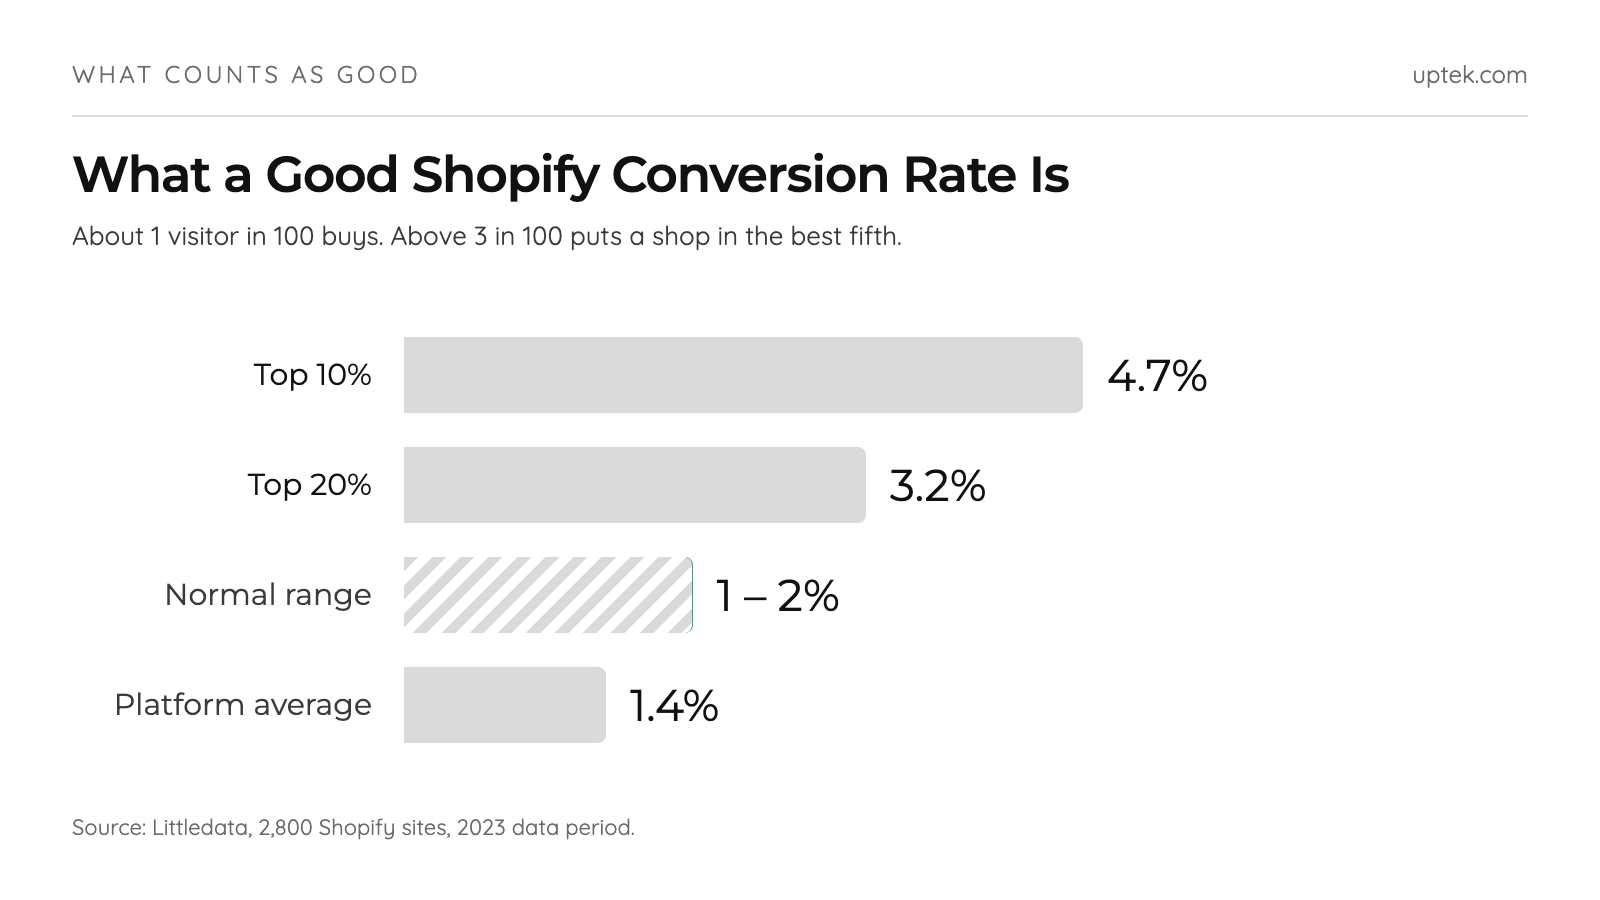
A good Shopify conversion rate is anything above 3.2%, the top-20% threshold in Littledata’s 2,800-site benchmark. Above 4.7% puts you in the top 10%.
Between 1% and 2%, you’re normal.
Category and device change the answer. In IRP Commerce’s June 2026 panel, 1% is strong against baby and child at 0.51% and poor against arts and crafts at 5.53%.
Run your own orders and sessions through our conversion rate calculator and see which side of 3.2% you land on.
Shopify Conversion Rate Metrics and Formulas
Conversion rate is orders divided by sessions, times 100. Sessions, not users.
| Metric | Formula | Benchmark | Source |
|---|---|---|---|
| Conversion rate | (Orders / Sessions) x 100 | 1.4%, 4.7% top 10% | Littledata, 2023 |
| Cart abandonment rate | 100 – (Purchases / Carts x 100) | 70.22% | Baymard |
| Checkout completion rate | (Completed / Started) x 100 | 44% mobile, 49% desktop | Littledata |
| Revenue per session | Revenue / Sessions | £1.89 | IRP, June 2026 |
Shopify’s Current Conversion Rate Statistics
The most current Shopify-only benchmark in public is Littledata’s 2,800-site study, 2023 data period.
Contentsquare’s wider panel is fresher, recording conversion down 5.1% year over year to Q4 2025 while order values rose 6%. Falling conversion is an industry condition, not a store-level failure.
If your rate dropped roughly 5% last year and your order value rose, you tracked the market. Nothing to fix.
Average Conversion Rate for Shopify Stores: 1.4%
According to Littledata’s benchmark of 2,800 Shopify sites, the average Shopify conversion rate is 1.4%, on a US$85 average order value.
Multiply the two and the average session is worth roughly $1.19. That number, not the percentage, is what your traffic has to cost less than.
Top-Performing Stores Conversion Rate: 4.7%
The top 10% of Shopify stores in Littledata’s benchmark convert at 4.7% or higher, and the top 20% clear 3.2%. The same study puts travel and finance at 0.2%.
The top decile skews toward larger merchants on different infrastructure, which our Shopify Plus benchmarks break down separately.
Anything above 4.7% and you’re in the top tenth of the platform.
Comparison with Industry Averages and Competitors
Shopify’s checkout outpaces competing platforms by up to 36%, and by 15.2% on like-to-like samples, per a study Shopify commissioned from an unnamed “Big Three” firm in April 2023. Sample size and date range are undisclosed.
Treat 36% as a ceiling. So which number belongs in a migration business case? Use 15.2%, the like-for-like figure, when you cost a migration onto Shopify.
Conversion Rates by Device
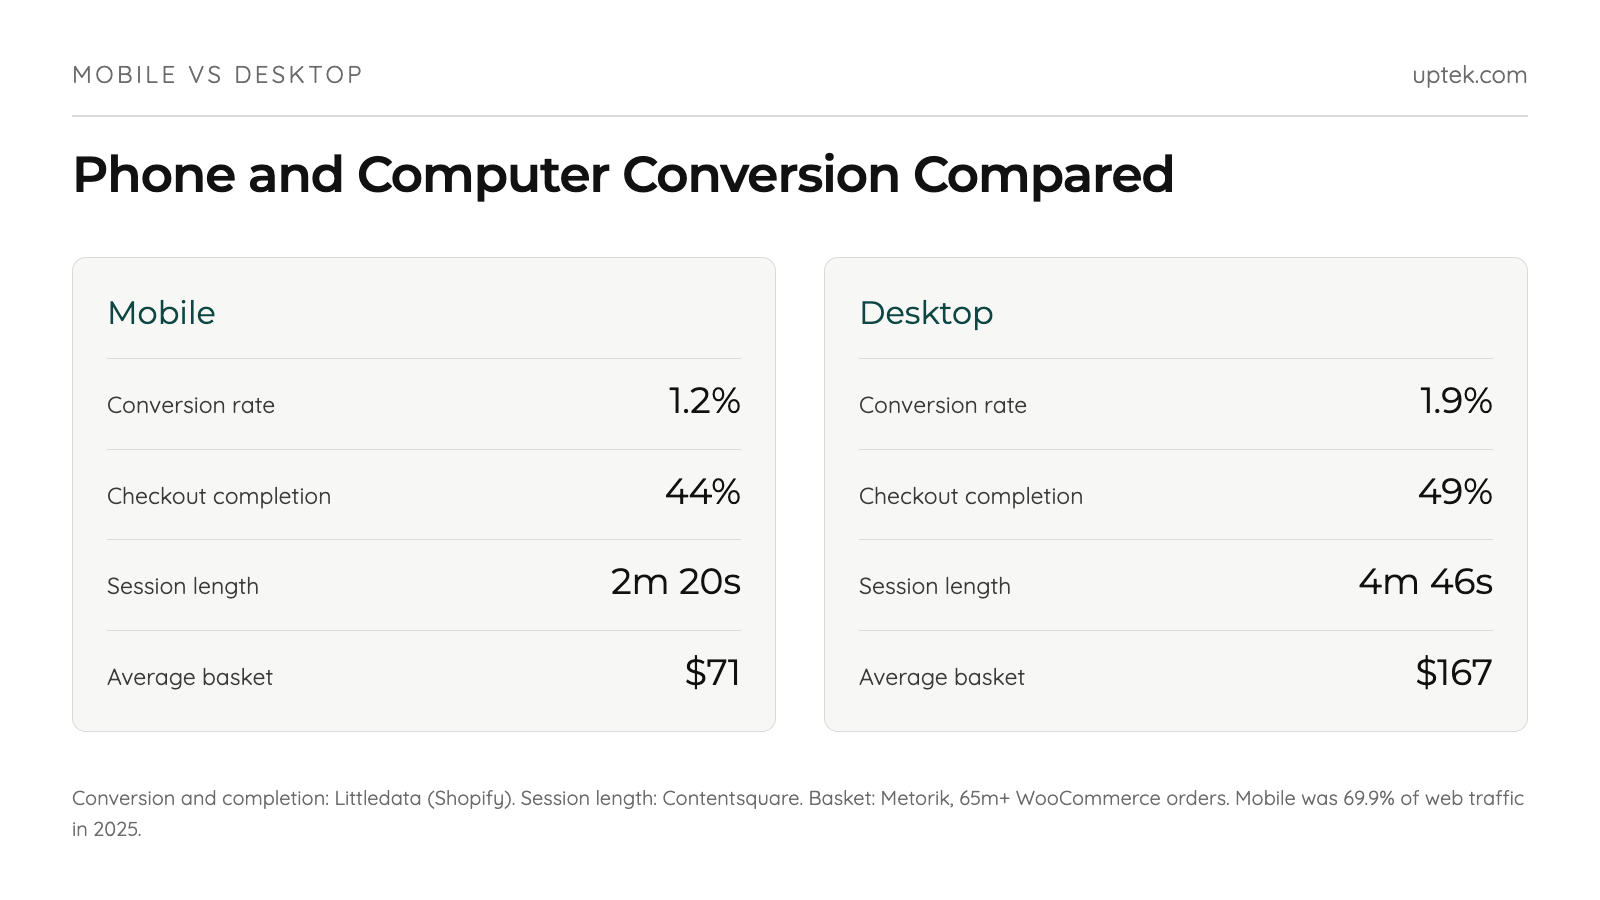
Desktop converted at 3.4% against mobile’s 2.0% in Contentsquare’s 2026 benchmark, a 74% advantage over 99 billion sessions, with retail alone at 3.7% against 2.0%.
Mobile vs. Desktop Conversion Rates
Littledata puts Shopify mobile at 1.2% and desktop at 1.9%, with the top 10% of stores clearing 3.9% and 6.5%. Desktop sessions last 4 minutes 46 seconds against mobile’s 2 minutes 20 seconds (Contentsquare).
Mobile trails desktop by 0.7 points on average and by 2.6 points in the top decile, and our statistics on Shopify themes break that gap down by template.
Mobile retention is up 10% and desktop down 7% (Contentsquare), so engagement is closing while conversion is not.
Checkout Completion Rates: Mobile (44%) vs. Desktop (49%)
Littledata’s Shopify data puts checkout completion at 44% on mobile and 49% on desktop. The figures in this heading came from a secondary source and are kept because other sites link to the anchor.
Implications of Mobile Traffic: 79% of Total Traffic
Mobile accounted for 69.9% of all web traffic in 2025 (Contentsquare), not the 79% this heading has carried. Three further dated measurements:
- 72% of orders, mobile and tablet, 2025 (Metorik, 65m+ WooCommerce orders)
- 63.5% of sales, against 35% desktop and 1.4% tablet, June 2026 (IRP Commerce)
- 56.4% of US holiday transactions, November and December 2025 (Adobe Analytics)
Mobile loses on basket size too, at $71 against desktop’s $167 (Metorik).
Both Metorik figures come from 65 million WooCommerce orders rather than Shopify ones, and our Shopify vs WooCommerce comparison sets out where the two platforms diverge.
Conversion Rates by Store Category
Single-product stores and narrow catalogues convert differently to broad ones, and the split shows up by category rather than by store size.
Contentsquare recorded retail at 3.7% on desktop against 2.0% on mobile, while its nine-industry average sat at 3.4% and 2.0%. Retail beats the cross-industry desktop average and matches it on mobile.
If your category sits below its own benchmark but above the platform’s 1.4%, you’re reading the wrong comparison.
Conversion Rates by Industry on Shopify
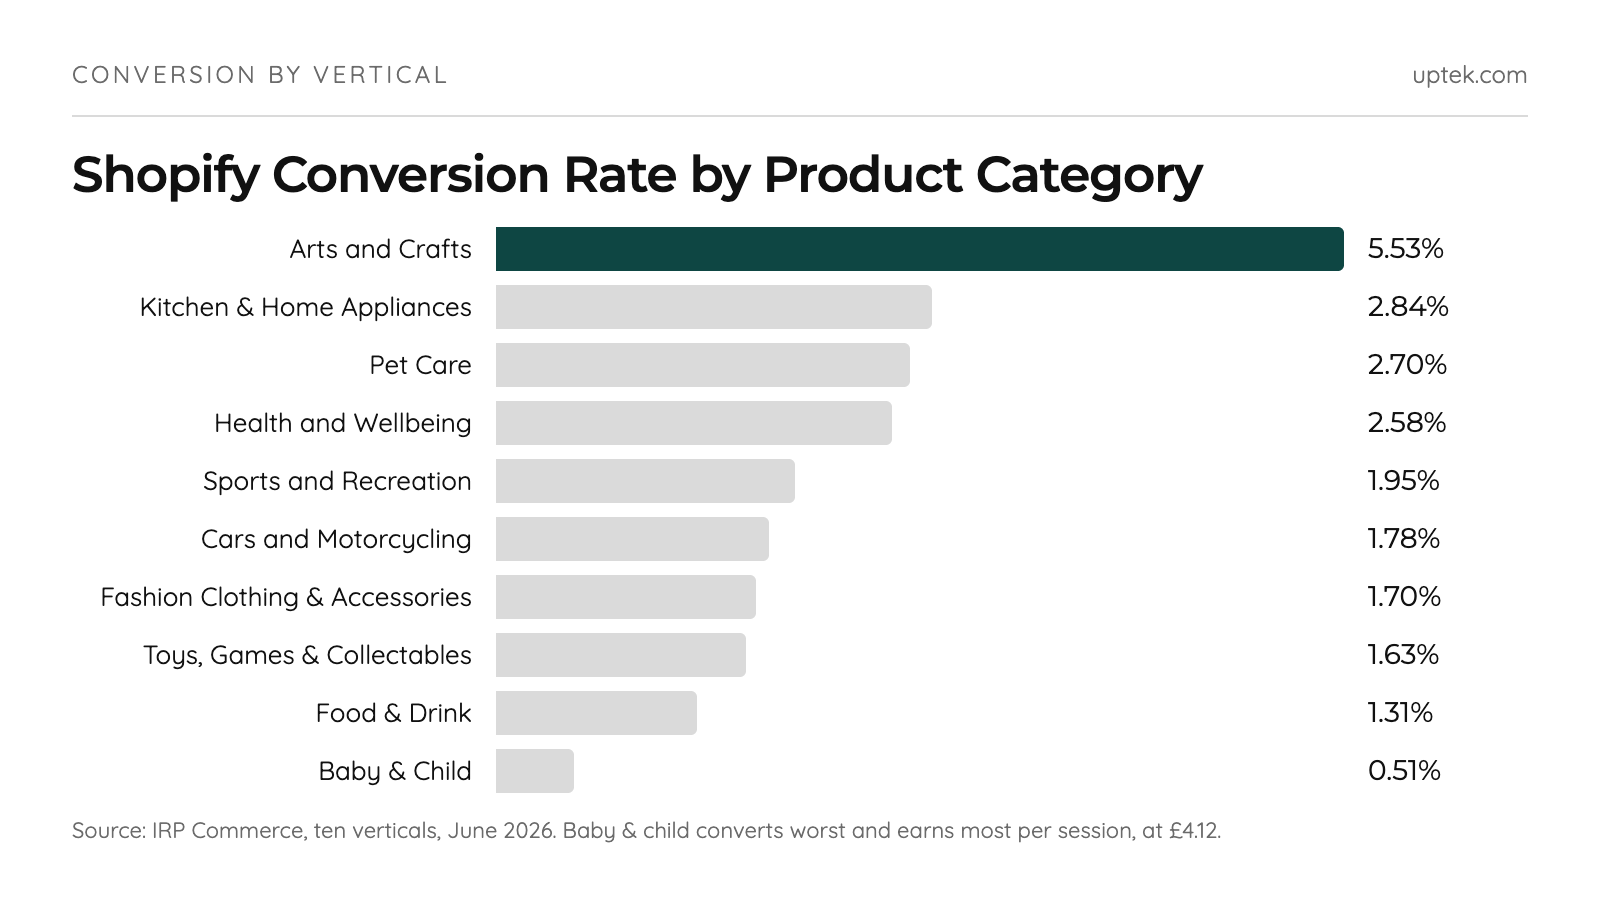
Conversion across the ten verticals IRP Commerce tracked in June 2026 ran from 5.53% in arts and crafts to 0.51% in baby and child. One month, one panel, one methodology.
| Vertical (IRP, June 2026) | Conversion rate |
|---|---|
| Arts and Crafts | 5.53% |
| Kitchen & Home Appliances | 2.84% |
| Pet Care | 2.70% |
| Health and Wellbeing | 2.58% |
| Sports and Recreation | 1.95% |
| Cars and Motorcycling | 1.78% |
| Fashion Clothing & Accessories | 1.70% |
| Toys, Games & Collectables | 1.63% |
| Food & Drink | 1.31% |
| Baby & Child | 0.51% |
Cars and motorcycling was the biggest mover, up 45.98% year on year.
Revenue Per Session Inverts the Table
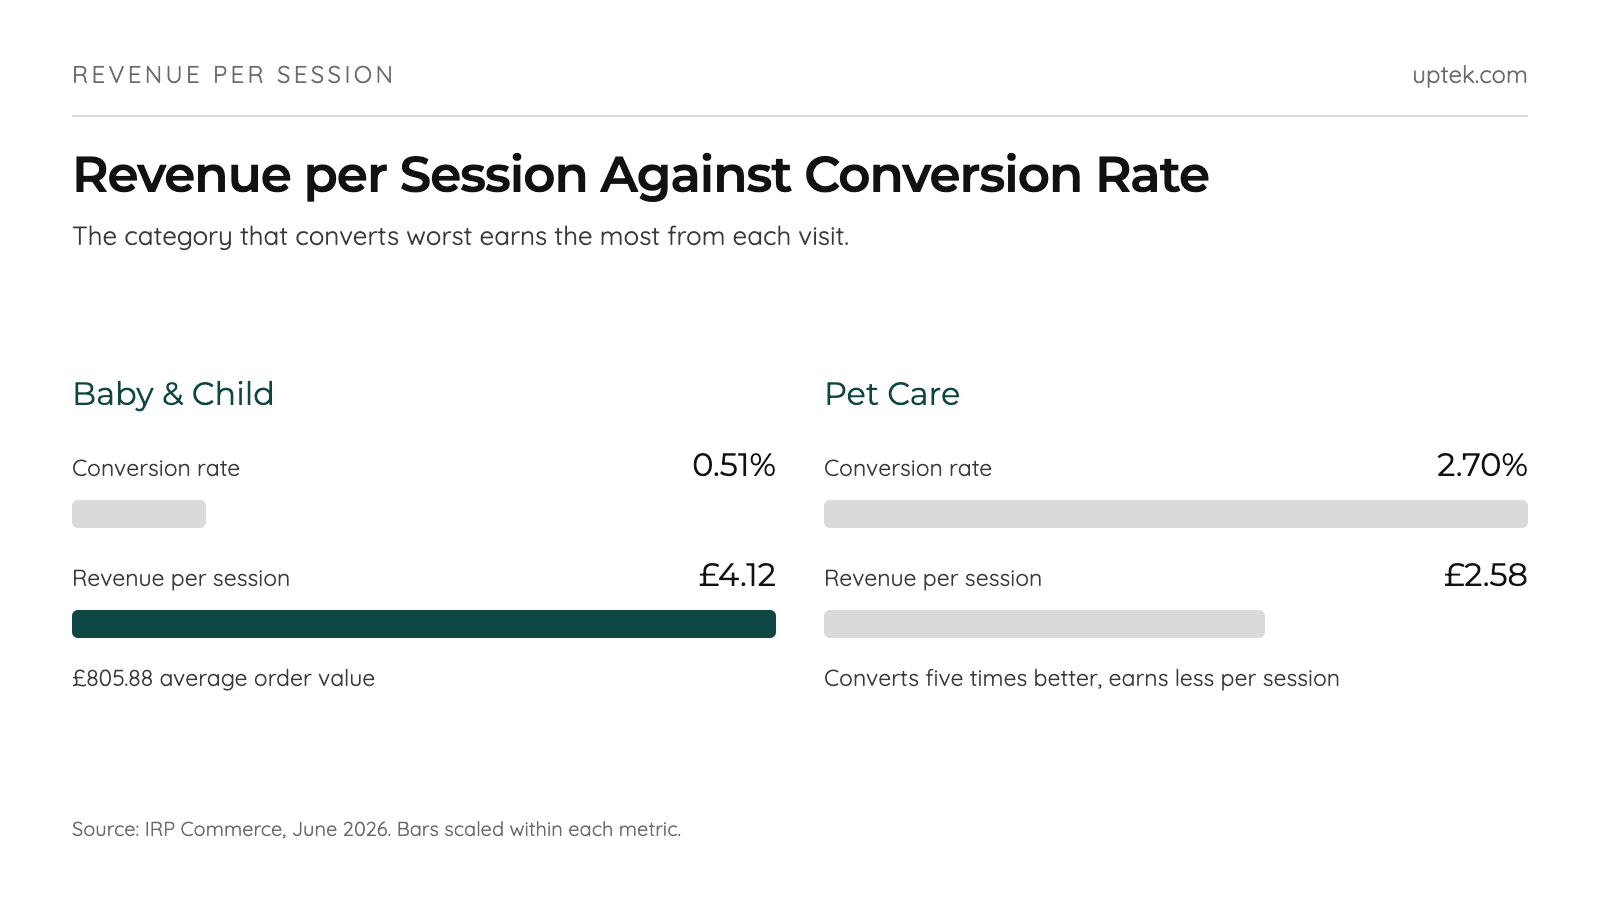
Baby and child converted worst in the IRP panel at 0.51% and earned the most per session at £4.12, on an £805.88 order value. Pet care converted five times better and earned £2.58.
A low rate on a high-value basket is not a fault.
A baby and child session is worth roughly 60% more than a pet care one, and store-level earnings sit on a different denominator in our Shopify merchant revenue data.
Work out what a session is worth before you rebuild anything.
Analysis of High-Performing Categories During Peak Seasons (e.g., Black Friday)
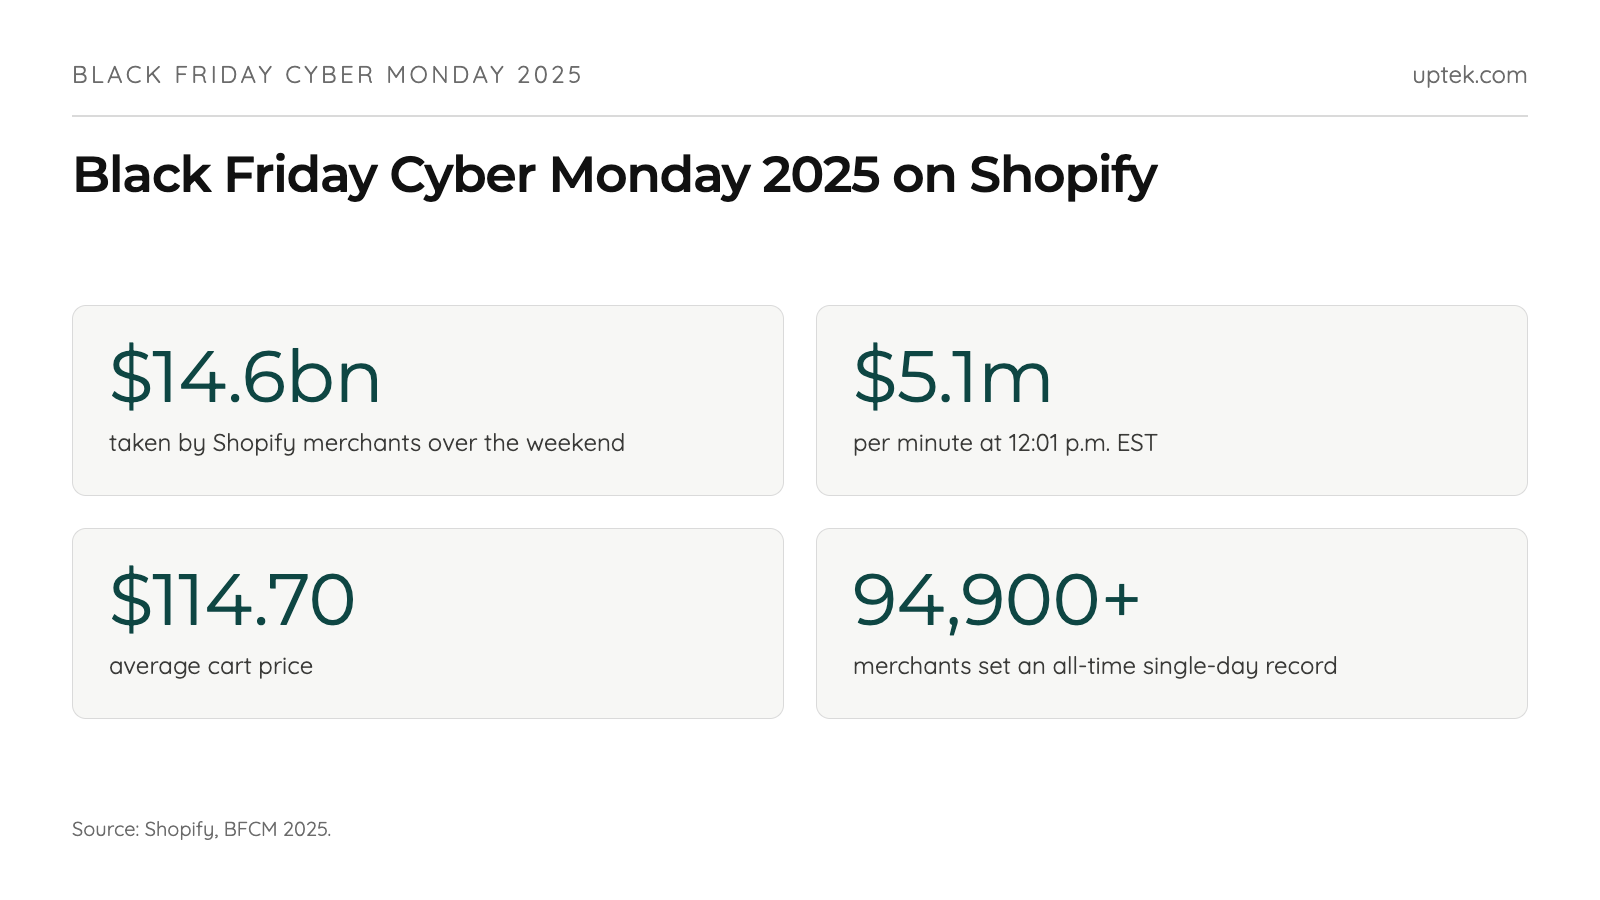
Shopify merchants took $14.6 billion over Black Friday Cyber Monday 2025, peaking at $5.1 million per minute at 12:01 p.m. EST. Average cart price was $114.70 and over 94,900 merchants set an all-time single-day record.
At $5.1 million a minute, the full $14.6 billion weekend would clear in under 48 hours, so peak rate ran well above average.
Key Shopify Checkout Statistics
65% of the 344 top-grossing US and EU sites Baymard benchmarked have a checkout rated mediocre or worse, and 2% rate as good. The average site has 32 fixes available.
Those 32 fixes aren’t equal, and ordering them by revenue impact is the whole job in a conversion rate optimization programme.
Baymard values the gain from checkout design alone at 35.26%, or $260 billion across a $738 billion sales base.
Cart Abandonment Rate: Current Abandonment Rates
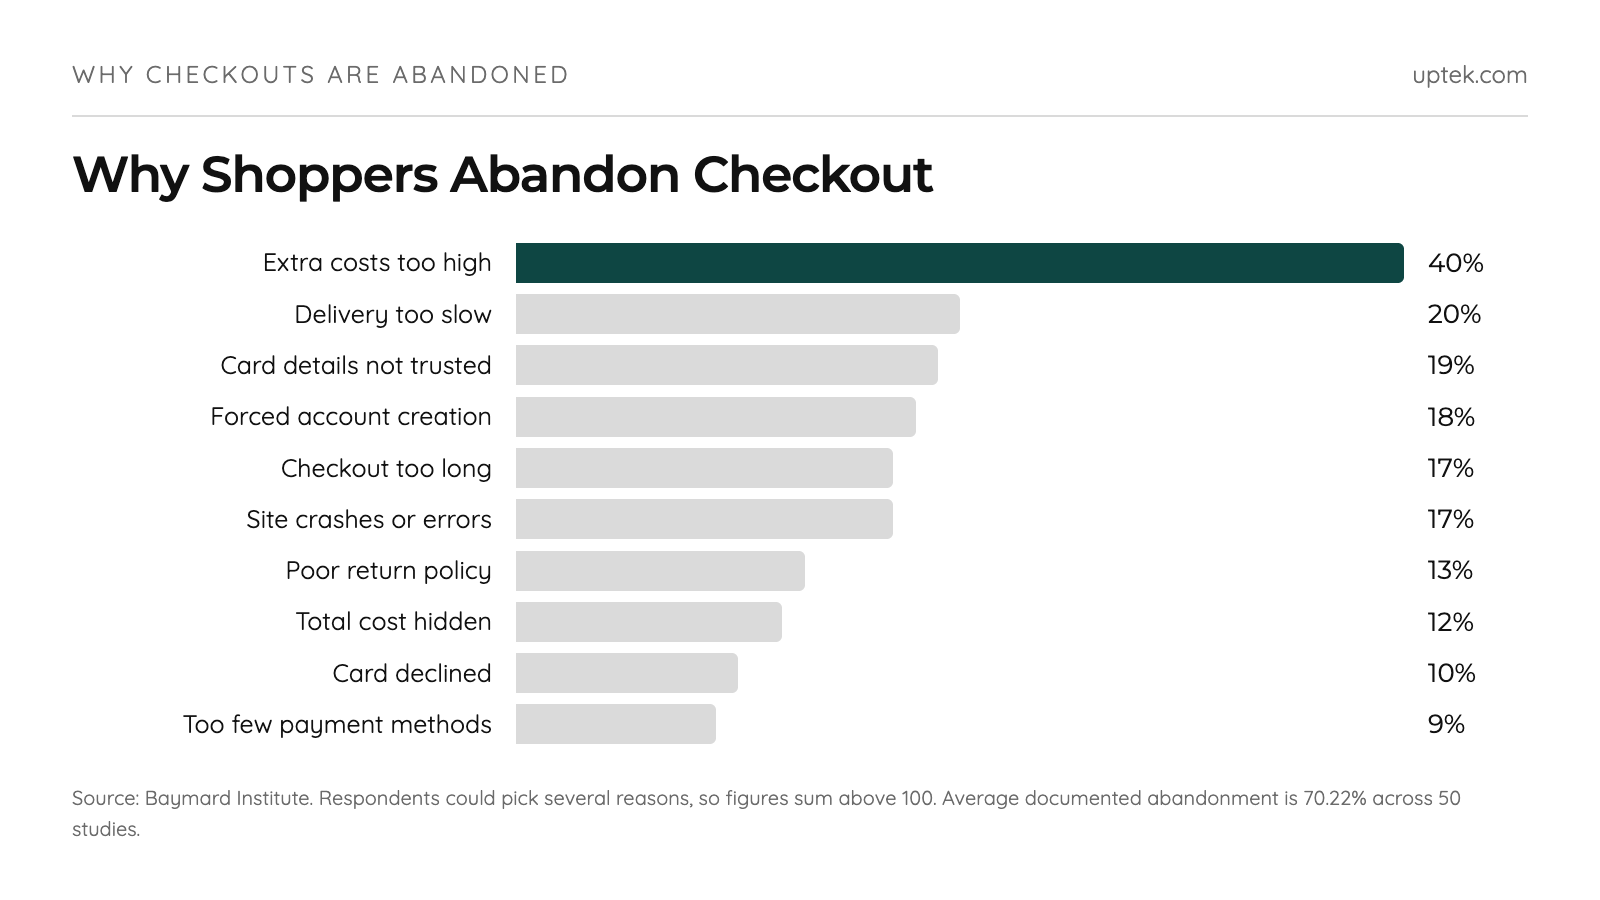
The average documented cart abandonment rate is 70.22% across 50 studies compiled by Baymard Institute. Most of it isn’t fixable.
42% of US shoppers abandoned a cart in the last three months because they were browsing. If you’re at 70% and blaming your checkout, roughly six in ten of those people were never buying.
That 42% is a traffic-mix figure rather than a checkout fault, so read it against the returning-buyer share in our statistics on Shopify customers.
Excluding those shoppers, Baymard ranks checkout abandonment reasons as:
- Extra costs too high: 40%
- Delivery too slow: 20%
- Card details not trusted: 19%
- Forced account creation: 18%
- Checkout too long: 17%
- Site crashes or errors: 17%
- Poor return policy: 13%
- Total cost hidden: 12%
- Card declined: 10%
- Too few payment methods: 9%
Respondents could pick several reasons, so the figures sum above 100.
Site errors cost nearly as much as forced registration, 17% against 18%. One is a design decision, the other is uptime, and most stores only audit the first.
Geographical Cart Abandonment Rates
Cart abandonment was highest in Mexico at 93% in Q1 2026, followed by South Korea and Spain at 88%, per Statista’s data on 21 countries. Values span 60% to 93%.
If you sell cross-border, benchmark the destination market. An 88% rate in Spain is normal and an 88% rate in a 60% market is not.
Factors Affecting Conversion Rates on Shopify
Three variables move Shopify conversion measurably: speed, checkout design and traffic mix.
Impact of Loading Speed on User Retention
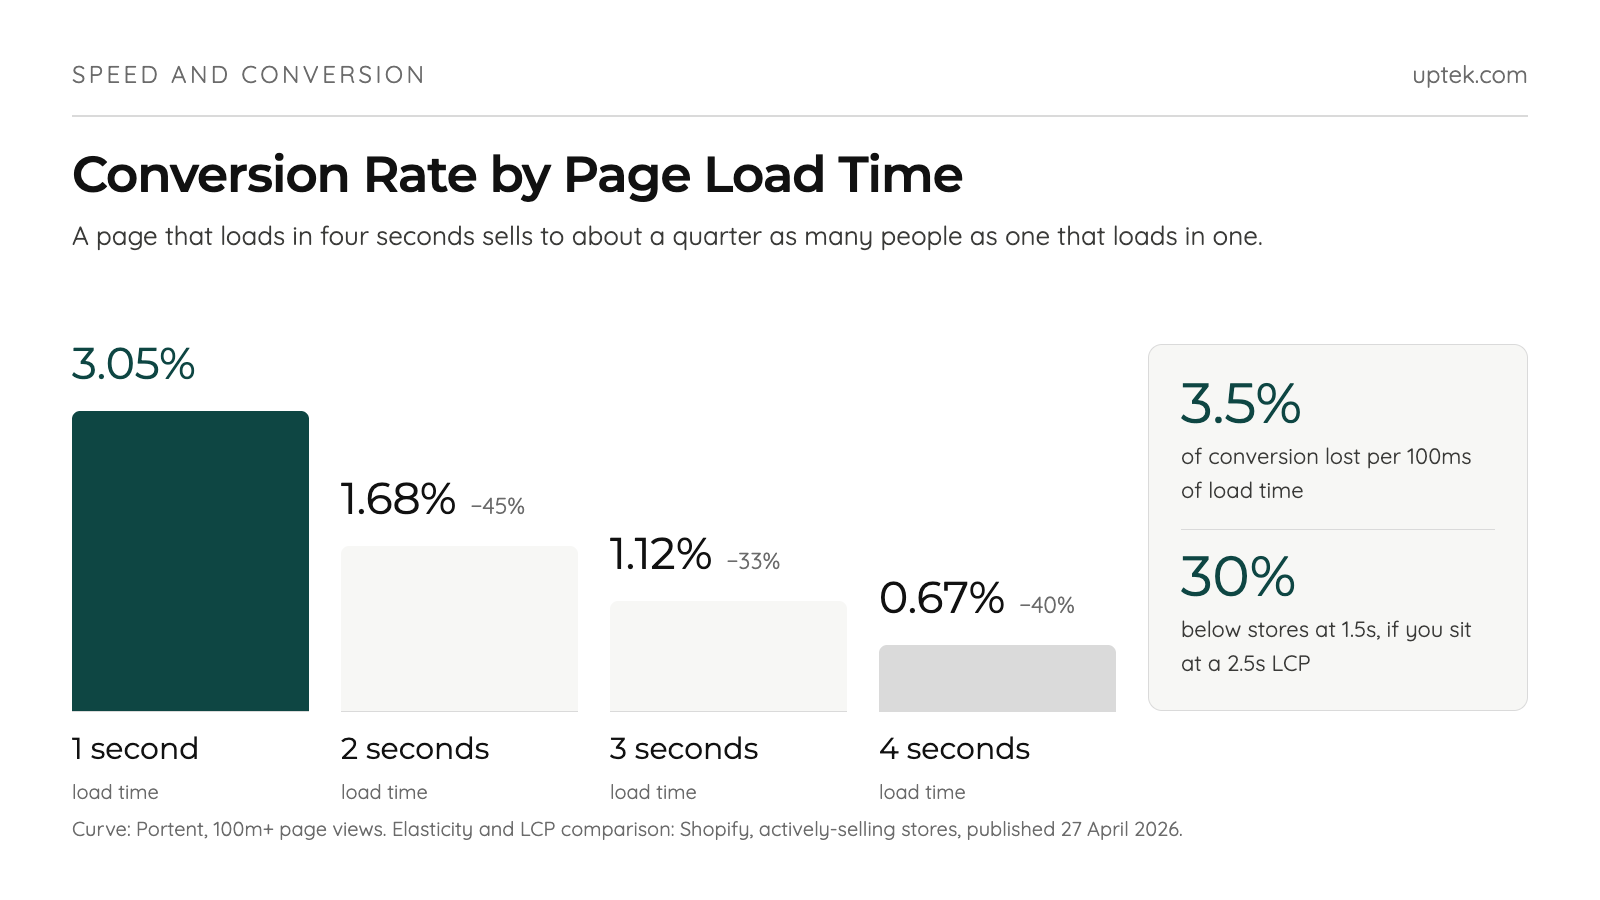
Every 100 milliseconds of extra load time costs about 3.5% of conversion, per Shopify’s analysis of actively-selling stores over 28 days in January and February 2026. Every 32 milliseconds of interaction delay costs about 1.5%.
Passing Core Web Vitals isn’t the finish line. Stores at a 2.5-second Largest Contentful Paint, exactly Google’s “good” threshold, convert roughly 30% below stores at 1.5 seconds.
Portent’s analysis of over 100 million page views gives the curve. Sites loading in one second convert at 3.05%, falling to 1.68% at two seconds, 1.12% at three and 0.67% at four.
The elasticity has roughly halved in a decade. Akamai measured 100ms of delay costing 7% of conversion across ~10 billion visits in 2017. Deloitte and 55 measured 100ms of improvement adding 8.4% for Google in 2019. Shopify’s figure is now 3.5%.
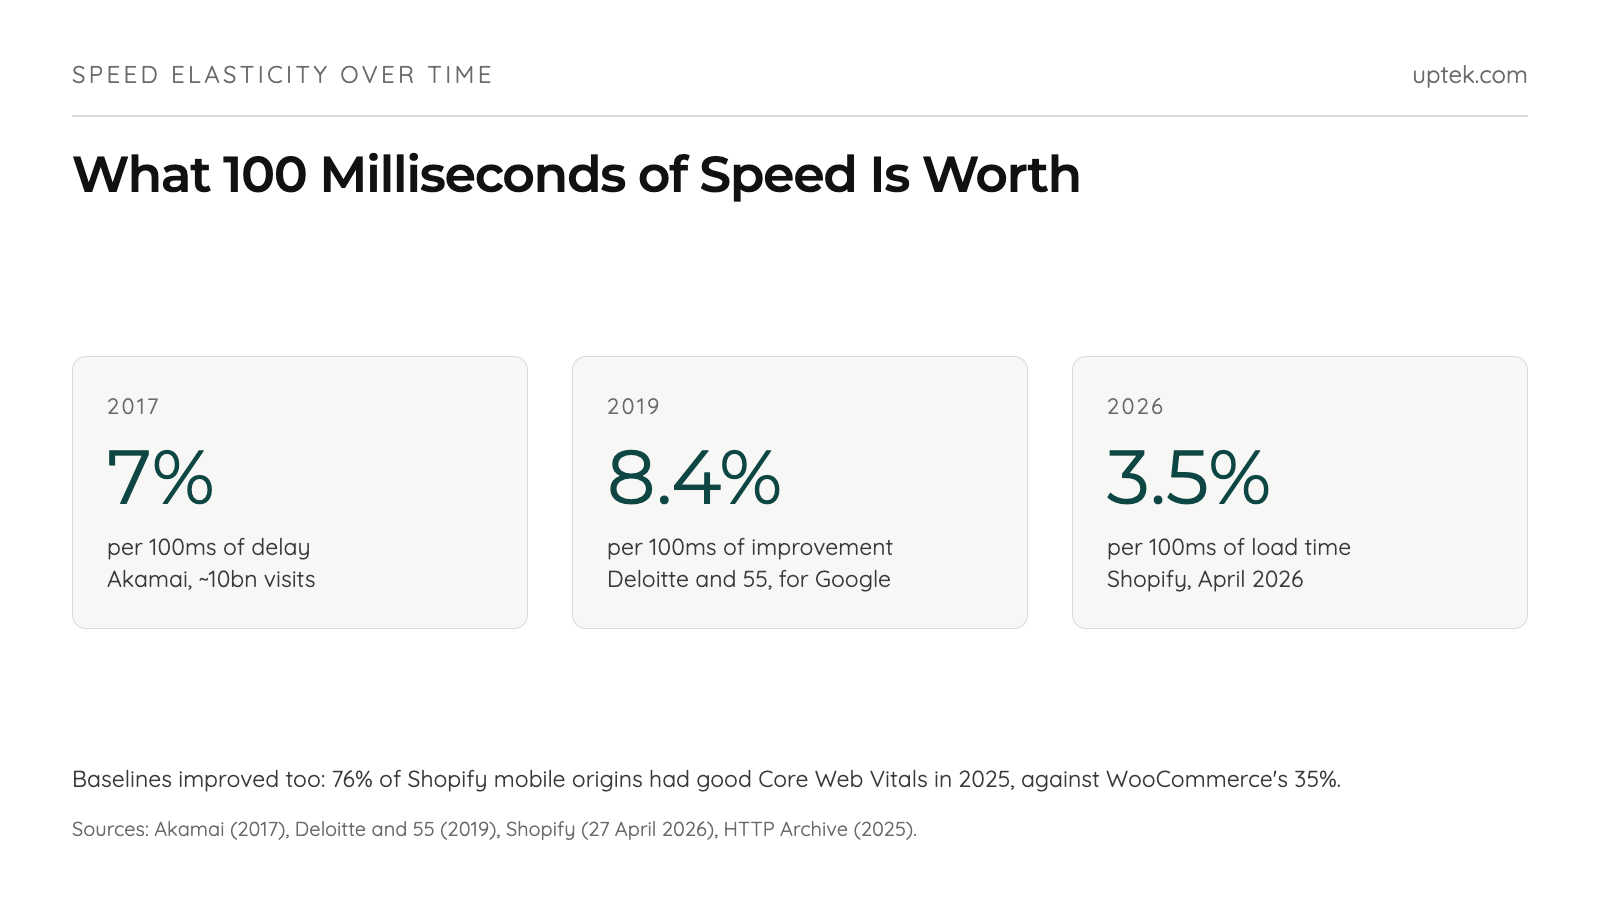
Baselines improved too. According to HTTP Archive, 76% of Shopify mobile origins had good Core Web Vitals in 2025 against WooCommerce’s 35%.
So which fix goes first? One second off a three-second store is worth about 35% at Shopify’s 3.5% per 100ms, which makes speed optimization for Shopify stores the highest-confidence job here.
Checkout Process
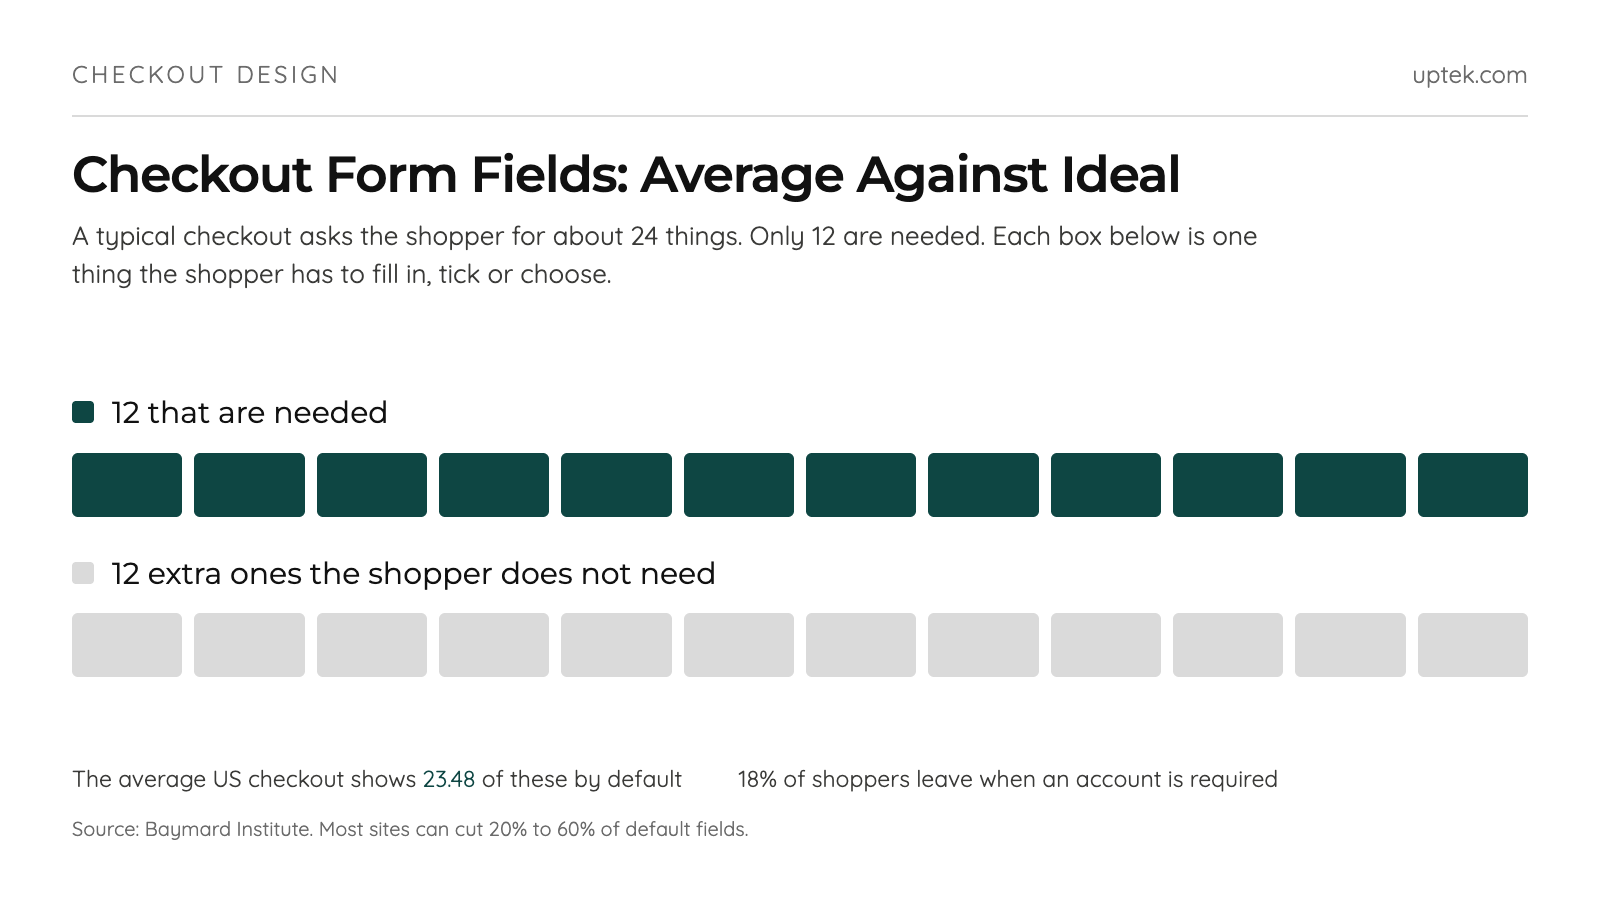
The average US ecommerce checkout displays 23.48 form elements by default, counting fields, checkboxes, drop-downs and radio buttons (Baymard). The ideal flow needs 12.
62% of sites fail to make guest checkout the most prominent option, which pairs with the 18% who abandon over forced registration. In a 2022 Baymard survey of 4,384 US adults, 24% had abandoned a cart that quarter for that reason alone.
If your checkout still forces an account, that’s your first fix.
Strategies to Streamline the Checkout Experience
Most sites can cut 20% to 60% of the form fields they show by default (Baymard). Shopify’s accelerated checkout figures, all from an April 2023 commissioned study:
- Shop Pay lifts checkout conversion up to 50% versus guest checkout
- The blended lift across all checkouts including mobile is 9%, and 18% for returning customers
- Displaying Shop Pay lifts lower-funnel conversion 5% even when shoppers don’t use it
- Shop Pay Installments cuts abandoned cart rate 28%, eligible US merchants only
One-page checkout is smaller, at 1.5% of cumulative platform lift to September 2023. Hemlock & Oak reported 7% and Stellar Eats 3.5%.
Getting from 23.48 fields to 12 is code, not configuration, and no app installs its way there.
AI Referral Traffic: Six Measurements, One Question
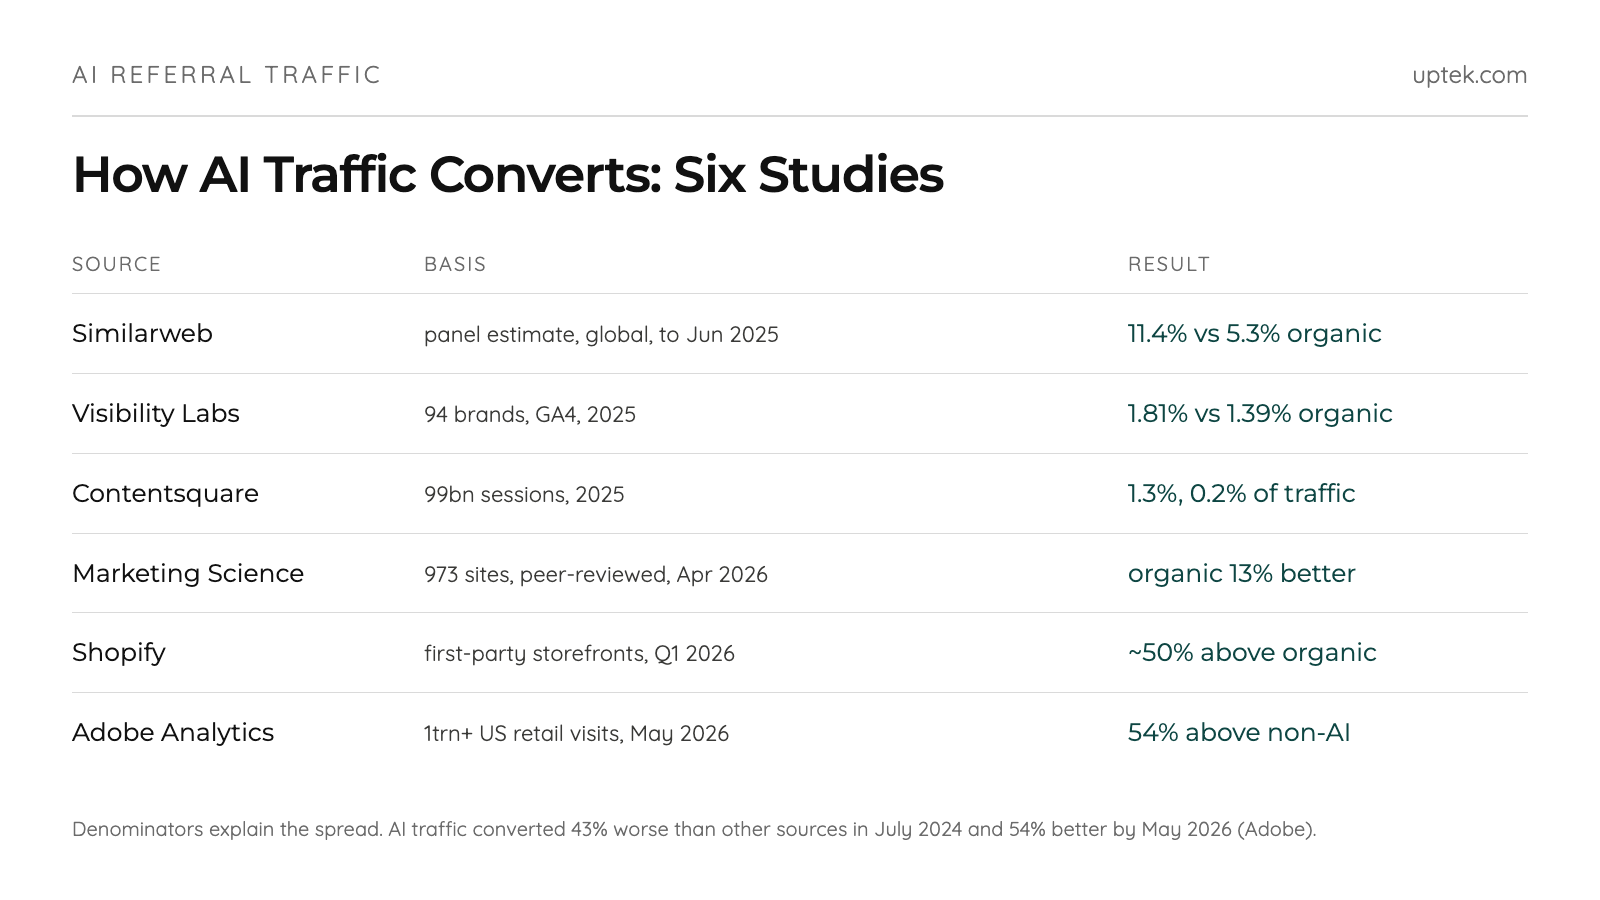
Six credible sources have measured how AI-referred traffic converts, and the answers span an order of magnitude.
| Source | Basis | Result |
|---|---|---|
| Similarweb (to Jun 2025) | panel estimate, global | 11.4% vs 5.3% organic |
| Visibility Labs (2025) | 94 brands, GA4 | 1.81% vs 1.39% organic |
| Contentsquare (2025) | 99bn sessions | 1.3%, 0.2% of traffic |
| Marketing Science (Apr 2026) | 973 sites, peer-reviewed | organic 13% better |
| Shopify (Q1 2026) | first-party storefronts | ~50% above organic |
| Adobe Analytics (May 2026) | 1trn+ US retail visits | 54% above non-AI |
Denominators explain the spread. Similarweb estimates visits from a panel rather than reading site analytics, so its levels run far above every GA4-measured figure.
Shopify compares sessions that begin on a product detail page, and more than half of AI sessions start there against 20% of organic sessions.
The direction of travel isn’t disputed. According to Adobe, AI traffic converted 43% worse than other sources in July 2024 and 54% better by May 2026. AI-referred orders on Shopify grew nearly 13x year over year in Q1 2026, against 8x for sessions.
Volume is the catch. Clicks roughly halve when an AI summary appears, 8% against 15% (Pew Research Center), so the same page now has to earn the click and the citation.
Strategies to Improve Conversion Rates
Applying Baymard’s 35.26% checkout uplift to Littledata’s 1.4% average gives a modelled 1.89%, before you touch traffic, price or product. Modelled, not measured.
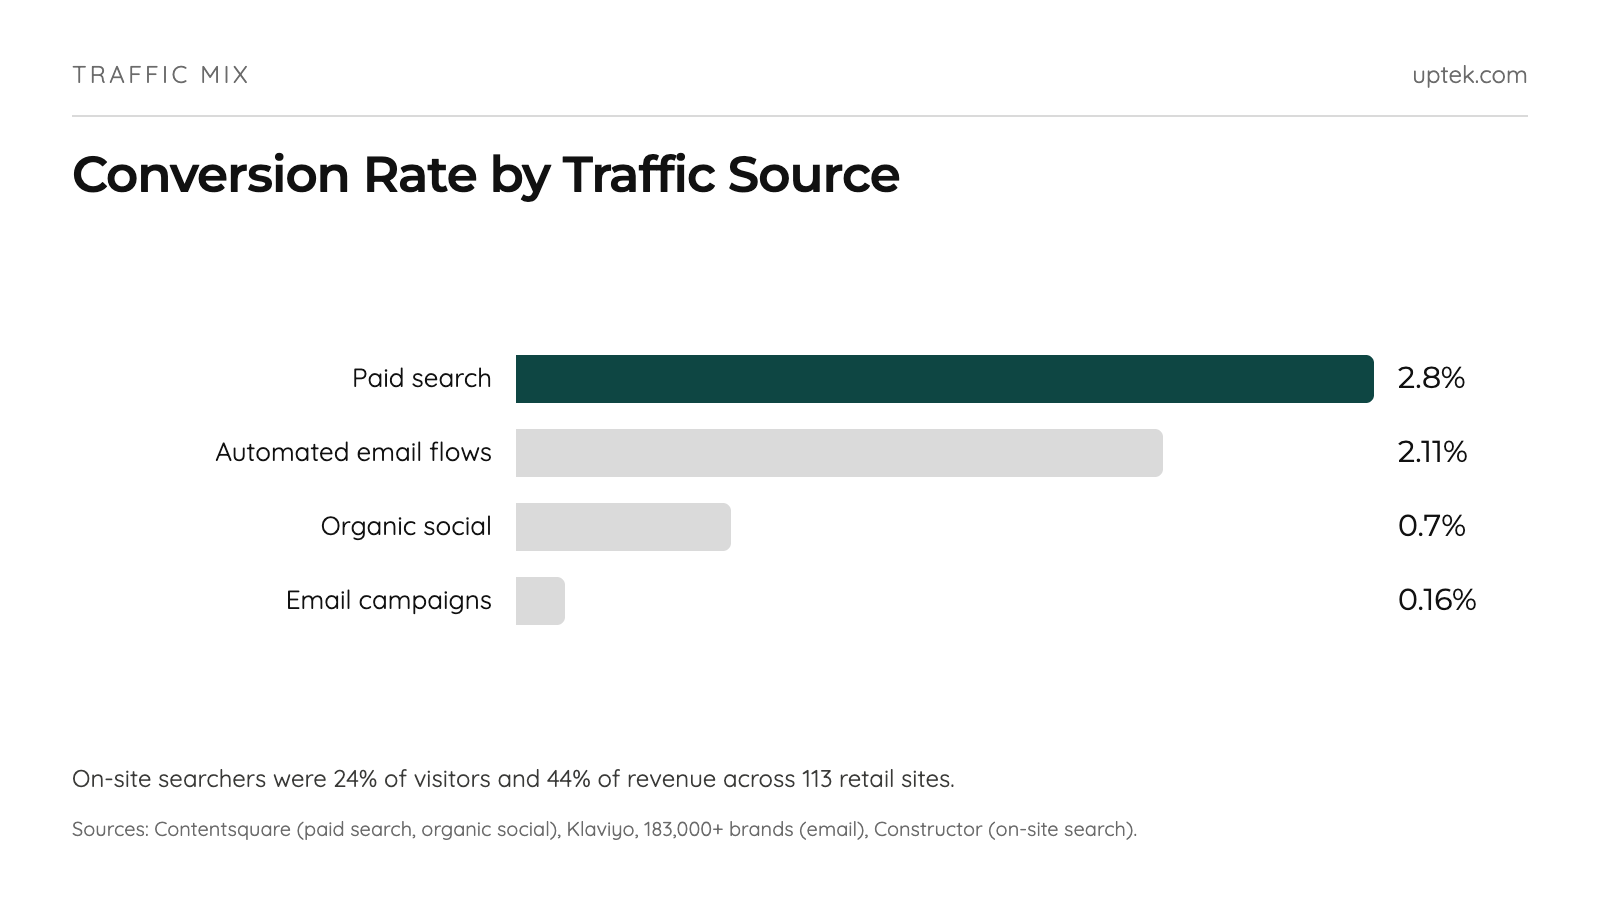
Traffic mix moves it further. Paid search converted at 2.8% against organic social’s 0.7% (Contentsquare). Automated email flows placed orders at 2.11% against 0.16% for campaigns, according to Klaviyo’s data on 183,000+ brands.
On-site searchers were 24% of visitors but 44% of revenue across 113 retail sites (Constructor). Search punches nearly twice its weight in that data, and most stores treat it as a theme setting.
If you’re running mostly organic social at 0.7%, no checkout fix will move you to 3%.
Frequently Asked Questions
Conclusion
Conversion rate on its own is worth very little. The average Shopify session is worth roughly $1.19 on Littledata’s figures, and the highest-earning vertical in IRP’s June 2026 panel is its worst-converting one.
Benchmark against your category, device split and traffic mix, then check revenue per session. If a session is worth more than the traffic costs and your rate still trails your vertical, the store is the problem.
Figures here are dated to their measurement period. Different panels use different populations, so they are not interchangeable.